
Computing a spectrogram [1]#
This simple example will only be covered with the Core API.
First, create an OSEkit AudioData from the audio file(s) on disk.
There are multiple ways to do so: here we’ll go throught the full process of parsing files into OSEkit AudioFiles:
from pathlib import Path
from osekit.core.audio_file import AudioFile

audio_folder = Path(r"_static/sample_audio/timestamped")
audio_files = [
    AudioFile(
        path=p,
        strptime_format="%y%m%d_%H%M%S",
    )
    for p in audio_folder.glob("*.wav")
]
Create the AudioData you want to plot a spectrogram of from the AudioFiles.
The AudioData can be freely distributed over multiple files, and you can even resample it.
An Instrument can be provided to the AudioData for the WAV data to be converted in pressure units. This will lead the resulting spectra to be expressed in dB SPL (rather than in dB FS):
from osekit.core.audio_data import AudioData
from osekit.core.instrument import Instrument
from osekit.utils.audio import Normalization
from pandas import Timestamp

audio_data = AudioData.from_files(
    audio_files,
    begin=Timestamp("2022-09-25 22:34:55"),
    end=Timestamp("2022-09-25 22:35:05"),
    sample_rate=40000,
    normalization=Normalization.DC_REJECT,  # Rejects the DC component
    instrument=Instrument(end_to_end_db=150.0),
)
Create a scipy.signal.ShortTimeFFT with the FFT parameters:
from scipy.signal import ShortTimeFFT
from scipy.signal.windows import hamming

sft = ShortTimeFFT(win=hamming(1024), hop=512, fs=audio_data.sample_rate)
Instantiate an OSEkit SpectroData, which is the object that will be used to plot spectrograms, export spectrum matrices etc.
from osekit.core.spectro_data import SpectroData

spectro_data = SpectroData.from_audio_data(
    data=audio_data,
    fft=sft,
    v_lim=(0.0, 150.0),  # Boundaries of the spectrogram
    colormap="viridis",  # This is the default value
)
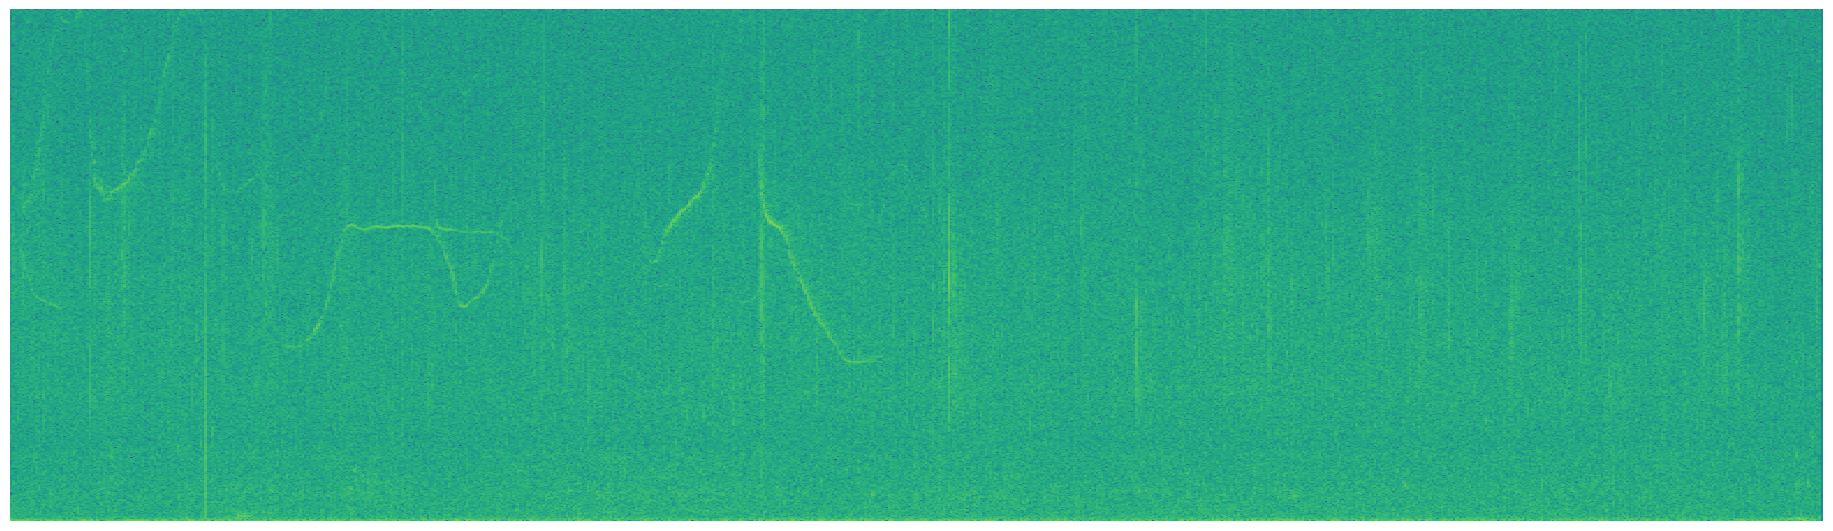
Plot the spectrogram using matplotlib.pyplot:
import matplotlib.pyplot as plt

# We store the spectrum matrix here to reuse it later in the notebook, this is not mandatory
sx = spectro_data.get_value()

spectro_data.plot(sx=sx)
plt.show()
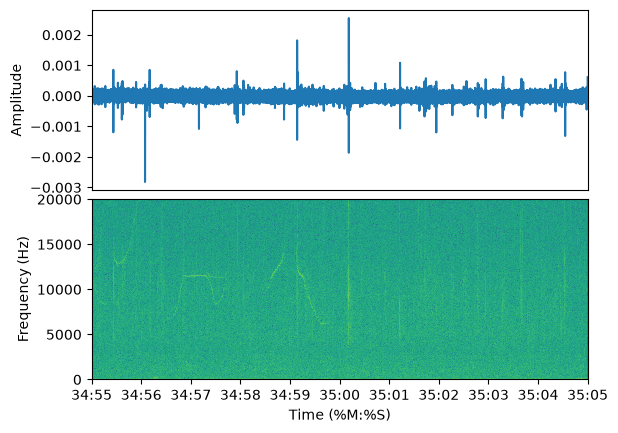
The spectrogram might be plotted next to the audio waveform:
fig, axs = plt.subplots(2, 1)

# Plotting the waveform in the top row:
spectro_data.audio_data.plot(ax=axs[0])

# Plotting the spectrogram in the bottom row:
spectro_data.plot(ax=axs[1], sx=sx)

# Setting the figure properties
import matplotlib.dates as mdates

axs[0].set_xlim(spectro_data.begin, spectro_data.end)
axs[0].set_xticks([])
axs[0].set_ylabel("Amplitude")

axs[1].set_ylabel("Frequency (Hz)")
axs[1].set_xlabel("Time (%M:%S)")
axs[1].xaxis.set_major_formatter(mdates.DateFormatter("%M:%S"))

fig.subplots_adjust(hspace=0.05)


plt.show()
You can export both the PNG spectrogram and the NPZ spectrum matrix to file:
# Write a NPZ file with the spectrum matrix:
spectro_data.write(folder=audio_folder / "export", sx=sx)

# Write a PNG image of the spectrogram
spectro_data.save_spectrogram(folder=audio_folder / "export", sx=sx)